Long Range Planning
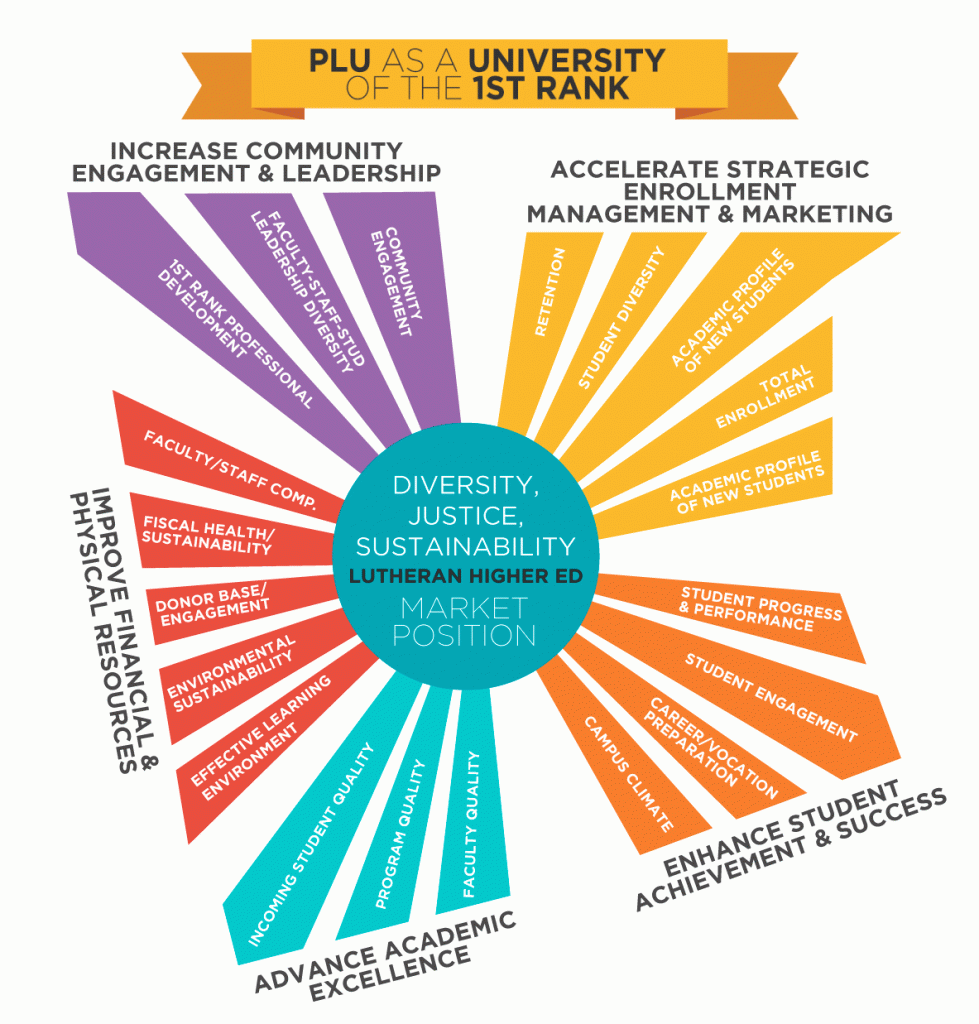
Pacific Lutheran University has identified three meta-priorities that infuse all of the work at the university: Lutheran Higher Education, Market Position, and Diversity, Justice and Sustainability (DJS).

| 2013 | 2014 | 2020 (GOAL) | |
|---|---|---|---|
| Faculty Quality | |||
| Excellence in Teaching, Scholarship, Service | Metrics created | ||
| Incoming Student Quality (measured under SEMAC priority) | |||
| Program Quality | |||
| Major/Minor Programs | |||
| % of disciplines w/honor societies | |||
| % of departments that are doing rubric-based/differential assessment | |||
| % of courses are incorporating best practices (pedagogical innovation) | |||
| General Education Program | |||
| Survey/Trend data with WRIT 101 assessment | Metric created | ||
| Gen Ed capstone class | Class started | ||
| Excellence in areas of distinction (Intl Educ, Student/Fac Collab, Vocation) | |||
| % of total students involved in one of these | |||
| % of UG graduating class that has done one/two/all of these | |||
| % of High Impact Practices as defined by AACU used by PLU |
| 2013 | 2014 | 2020 (GOAL) | |
|---|---|---|---|
| Career/Vocation Preparation | |||
| Alumni Success Survey results (satisfaction and preparation) | |||
| % of students participating in areas of distinction (Intl Education,Stu/Fac Collab, Vocation) | |||
| Employment rates of recent grads | |||
| Student Engagement | |||
| % of students in academic honor societies | |||
| % of participation in student elections | |||
| Campus Climate | |||
| 1st Year Student Perception of Belonging Composite Score | |||
| Campus Pride Index | |||
| Student Satisfaction Index | |||
| Retention Rate of faculty/staff | |||
| Student Progress and Performance | |||
| 6-year graduation Rate | |||
| # of prestigious post-graduate awards | |||
| Licensure exam passing rate (NCLEX, MSF, CPA) | |||
| Graduate school/Professional School placement |
| 2013 | 2014 | 2020 (GOAL) | |
|---|---|---|---|
| 1st Rank Professional Development | |||
| % of faculty/staff who attend Professional Development annually | |||
| Faculty, Staff, Student Leadership Diversity | |||
| Proportion of faculty/staff diversity to student diversity (defined by census categories) | |||
| % diversity in leadership roles | |||
| Community Engagement | |||
| Students | |||
| #/% of students enrolled in CEL courses during time at PLU | |||
| Faculty/Academic Programs | |||
| % of overall courses that include a CEL component | |||
| % of academic departments that include CEL/Internships in the curriculum | |||
| Staff | |||
| # of staff who volunteer with local community partners 30+hours/year | |||
| Community Partners | |||
| # of high quality community partners with PLU (defined by CCES/Career Connections) | |||
| Institution | |||
| Receive Carnegie Classification for Community Engagement in 2020 |
| 2013 | 2014 | 2020 (GOAL) | |
|---|---|---|---|
| Retention | |||
| First-year retention to year 2 | 81% | 81% | 90% |
| Transfer retention to year 2 | 70% | 76% | 80% |
| Total Enrollment | |||
| Total Number | 3462 | 3275 | 3800 |
| Undergraduate Number | 3124 | 2959 | 3150 |
| Graduate Number | 320 | 316 | 650 |
| Student Diversity | |||
| % of students of color (or URM) | 23% | Reflects regional ethnic diversity | |
| #/% of military-affiliated students | 200 | 350 | |
| Academic Profile of Incoming New Students | |||
| First-Year student average SAT | 1098 | 1095 | TBD |
| First-Year student average gpa | 3.66 | 3.66 | TBD |
| Transfer student average gpa | 3.26 | 3.32 | TBD |
| Graduation Rates (UG) | |||
| 4-year | 51% | 57% | 65% |
| 6-year | 70% | 67% | 75% |
| Transfer 2-year (for those staring w/60+ hours) |
| 2013 | 2014 | 2020 (GOAL) | |
|---|---|---|---|
| Effective Learning Environment | |||
| Campus Climate | Measure created & tracked | ||
| Deferred Maintenance Amount | unknown | $168 million | Less than $168 million |
| Best Practice Level for maintenance spending | $3 million | $6 million | |
| x % of buildings will be above 70% on NAV score | 50% | 50% | 70% |
| Quality Classroom space (grade of "B") | 70% | Survey not done | 90% at "B" or above |
| Faculty/Staff Compensation | |||
| % of positions at or above median income | TBD by Committee | ||
| Faculty at median income for 17-competitor set | Be at Median | ||
| CUPA & Chronicle % | Be at Median | ||
| Fiscal Health/Sustainability | |||
| Student Debt of our graduates % among 17-school peer group | #1 | #1 | Not be #1 on the list w/Highest debt |
| % of Operating Revenue from Non-tuition sources | 10% | 10% | 25% |
| Endowment/1 year budget | $79,585,706 | $84,365,076 | $86,000,000 |
| Donor Base/Engagement | |||
| Alumni Engagement | Measure created & tracked | ||
| Total Gifts and Commitments | $7,640,634 | $7,606,075 | |
| Overall Number of Donors | 8,082 | 9,132 | 9,500 |
| Overall Donor Retention Rate | not tracked | 63% | 70% |
| Environmental Sustainability | |||
| STARS Rating based on rigorous reporting | Gold | N/A | TBD by Sustainability Committee |


